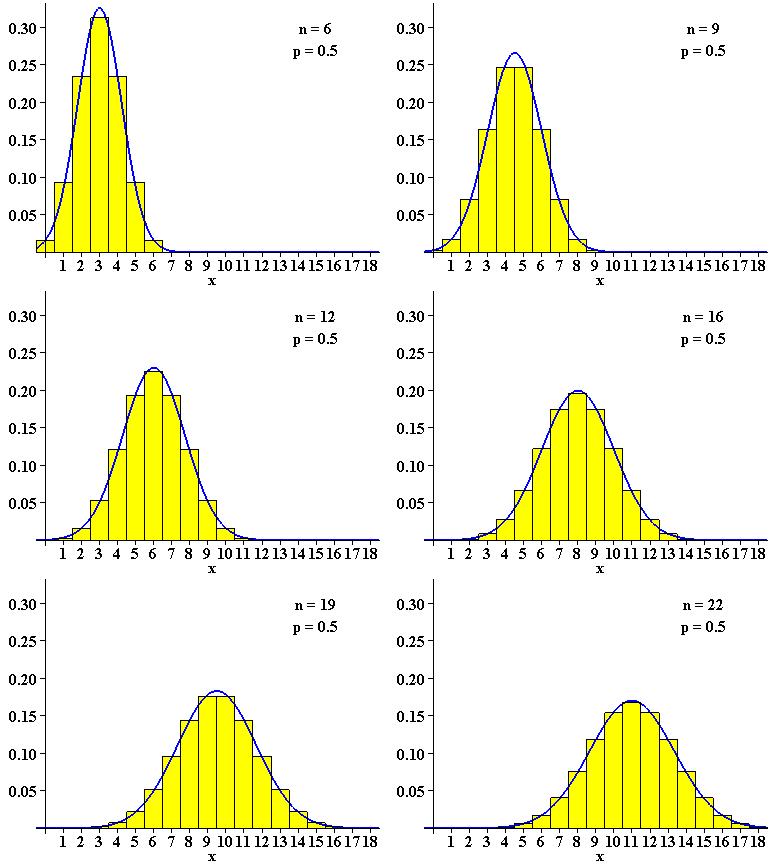
| Figure 5.5-2:
Binomial Probability Histograms, b(n, 0.25), n = 2, 4, ..., 32. |
 |
| Figure 5.5-2:
Binomial Probability Histograms, b(10, p), p = 0.05, 0.10, ..., 0.95. |
 |
| Figure 5.5-2:
Binomial Probability Histograms, b(n, 0.25), n = 2, 4, ..., 32. |
 |
| Figure 5.5-2:
Binomial Probability Histograms, b(10, p), p = 0.05, 0.10, ..., 0.95. |
 |